


Article/Document:
Physical Traces Associated with Unidentified Flying Objects: An Interim Report - Results of Processing Data - 1490 - 2004
Ted R. Phillips, Center for Physical Trace Research
original source | fair use notice
Summary: This report presents a statistical analysis of data given in 3,059 reports involving observations of anomalous phenomena or objects on or near the ground resulting in physical residues generated by the observed phenomena or objects. These observations took place in 91 countries between 1490 and 2004.
INTRODUCTION
This report presents a statistical analysis of data given in
3,059 reports involving observations of anomalous phenomena or
objects on or near the ground resulting in physical residues
generated by the observed phenomena or objects. These
observations took place in 91 countries between 1490 and 2004.
The analysis permits certain regularities of these phenomena to
be brought out. The data indicates there is a certain type of
phenomenon which shows stable statistical properties.
This research began in 1968 and after 36 years it is yet
premature to consider the nature of these phenomena on the basis
of the data presented to date. The developments of methods of
obtaining more reliable data and expansion of the initial
information used will result in a database of the most important
piece of the UFO puzzle - physical evidence.
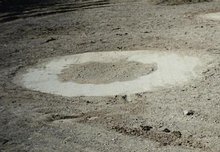
At this point there seems to be no relation to the more popular
crop circles which are much larger and complex than UFO landing
sites. The current problem is the inclination on the part of
investigators to identify possible landing sites as crop circles
- if it's circular, it must be a crop circle.
SUGGESTED FUTURE RESEARCH
To obtain more definite conclusions, more reliable and detailed
data must be obtained. These events must be well documented and
sampled for laboratory analysis. There needs to be a central
repository for landing/physical evidence events. Currently, the
data is scattered among numerous investigators in many
countries.
A central repository should produce interim reports to be
available to the general public and serious investigators. This
will produce new data and a much more complete database. The
entire database should be available in some form as physical
trace events will give us the most substantial evidence for - or
against - the existence of Unidentified Flying Objects.
Fig. 1 - DISTRIBUTION OF EVENTS BY YEAR
Pre 1900 24 cases 0.78%
1900 - 1939 22 cases 0.72%
1940 - 1949 28 cases 0.92%
1950 - 1959 303 cases 9.91%
1960 - 1969 534 cases 17.46%
1970 - 1979 1109 cases 36.25%
1980 - 1989 498 cases 16.28%
1990 - 1999 435 cases 14.22%
2000 - 2004 106 cases 3.46%
Fig. 2 - PEAK YEAR DISTRIBUTION
1954 105 CASES 3.43%
1969 133 CASES 4.35%
1973 159 CASES 5.20%
1974 125 CASES 4.01%
1975 147 CASES 4.81%
1976 114 CASES 3.73%
1977 119 CASES 3.90%
1979 121 CASES 4.00%
1980 103 CASES 3.37%
TOTALS 1126 CASES 36.80%
Fig. 3 - PEAK TIME DISTRIBUTION
(local times)
2300 256 cases
2000 251 cases
2100 245 cases
2200 200 cases
0200 142 cases
2400 137 cases
1900 137 cases
0400 124 cases
1700 119 cases
1800 98 cases
Fig. 4 - PEAK DISTRIBUTION COUNTRIES
United States 979 cases
France 245 cases
Canada 214 cases
Brazil 199 cases
Italy 184 cases
Australia 168 cases
England 168 cases
New Zealand 153 cases
Argentina 122 cases
Venezuela 93 cases
----------
2525 cases
Fig. 5 - PEAK DISTRIBUTION STATES
Missouri 43 cases
Iowa 39 cases
Illinois 38 cases
California 35 cases
Indiana 33 cases
Multiple Witness Events: 40.4% (1,236 cases)
Occupants/Beings Reported: 23.9% (731 cases)
More than one being seen: 63.2% (461 cases)
Being described as small: 57.1% (417 cases)
Fig. 6 - SHAPE DISTRIBUTION OF OBJECTS
Circular 57.2%
Oval 21.2%
Sphere 14.6%
Cylinder/Cigar 6.0%
Various Shapes 1.0%
Fig. 7 - OBJECT COLOR
Metallic 59.6%
Red 11.0%
White 10.1%
Orange-Red 5.5%
Orange 3.7%
Yellow 3.7%
Blue-White 2.8%
Green 2.8%
Gold 0.8%
Fig. 8 - SOUND RELATED TO OBJECT
Sound Heard 9.3%
Whistling 31.1%
Humming 22.6%
Hissing 11.3%
Buzzing 11.1%
Beeping 10.0%
"Electronic" 10.0%
Roaring 4.9%
Graph below indicates the object dimensions as estimated by
witnesses. Dimensions in meters are as follows;
A: one - three B: four - seven
C: eight - twelve D: twelve - sixteen
E: seventeen - twenty-one F: twenty-two - twenty-five
G: twenty-five +
Read more articles on this topic:
Physical Trace Cases


